

Financial data sources are a very sensitive segment that can significantly affect market developments. Often the data are combined and expressed through parameters based on which current trends are monitored. Based on the mentioned indicators, experts try to predict future events and thus earn money. Cryptocurrency markets are governed by identical laws, although it’s a self-regulating market. The difference between this and other currency markets is that it generates much more information that isn’t concentrated and thus can confuse investors and lead to moving in the wrong direction. The processing of data on market trends implies a group of complex calculations, and more recently the application of artificial intelligence. Considering the risk involved in cryptocurrency trading, traders are advised to conduct a good analysis of the current stock market situation before embarking on investments.
The analysis is undoubtedly very important for traders as it helps them gain a clear picture of currency movements at a given time. That way, they’ll best decide which is the right time to buy or sell. The three basic types of analyzes performed are:
Technical analysis that involves the presentation of statistical movements supported by indicators such as price movements or the volume of trade. Proponents of this type of analysis believe that by following historical data, they can easily conclude what will happen in the future. Still, it doesn’t have to mean that’s certain.
Fundamental analysis implies more thorough research and a different approach to this problem. They don’t attach so much importance to price oscillations, but the sphere of interest are the factors that dictate prices, such as the current economic situation or the value of assets. They are trying to determine where the value of the cryptocurrency actually comes from and whether it is real.
Sentimental analysis advocates the theory that data isn’t always relevant. The perception of other consumers or journalists can be created by traders.
Read on and find out what are the popular ways to conduct data analysis in the cryptocurrency market in the text that follows.
1. By tracking Open-High-Low-Close charts
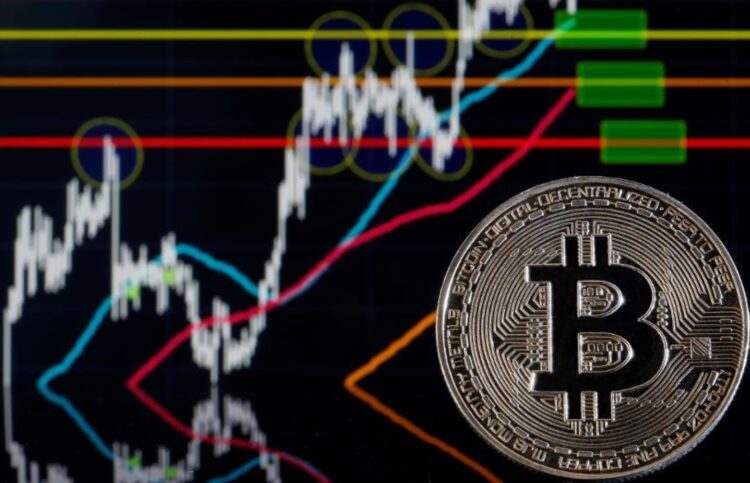
The first method (and the most commonly used one) is to track available charts. The charts you’ll encounter when you start the technical analysis are the so-called ‘candlesticks’. Their shape and color show constant price variations. OHLC charts will show you how prices move during the day, week or month in a very simple way, and in that way, you can get a true picture of what the market situation is like and when the right time to react is.
This method with candles was developed in Japan in the 18th century in order to gain insight into the movement of the price of rice. Today it’s used in the cryptocurrency market. The graphs consist of one medium-thicker rectangular section and two thin columns at the top and bottom.
When prices rise, the candlestick turns green, in which case the bottom of the lower pillar represents the lowest price reached during a trading session, while the top of the upper pillar represents the highest recorded price.

2. Using popular techniques
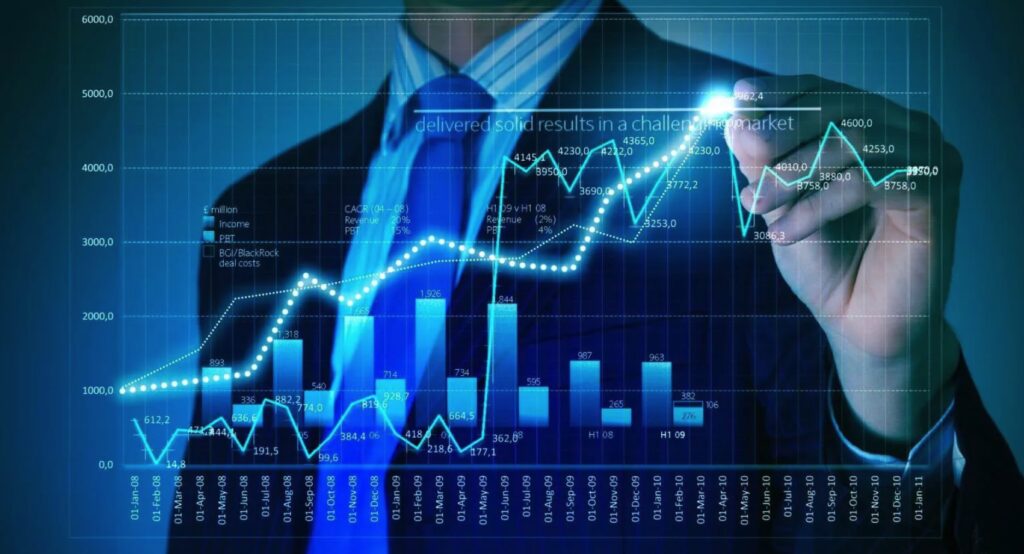
Another popular technique we single out is the trend line. The goal of this technique is to detect cryptocurrency fluctuations. It enables monitoring of its growth, as well as recording the moments in which it reaches its maximum.
Also, one can notice the moment of continuous price drop if it exists. Once this technique is combined with candlestick charts, a much more complete picture of the market situation is obtained. In that way, traders are enabled to clearly see whether the optimal condition or a complete collapse are announced. This further implies that participants will find it easier to make decisions about their own strategies.
Moving average is another technique that can be helpful when performing analysis. This trend might be applied in the short or long term, depending on one’s own interests. The essence is to monitor the average values of crypto-funds in the selected time frames. This includes standard prices that can fluctuate to a greater or lesser extent over time. However, it’s necessary to follow this situation in order to choose the right moment and the right strategy that we would apply.
3. Using available tools
Charts and techniques mentioned can sometimes be confusing. In that case, various tools are available on the Internet through which you can perform crypto data analysis. They contain the previously mentioned graphs, but also tabular simplified representations. Each of them draws its own conclusions based on the data collected and each has conducted its own research, so you won’t come across the same information everywhere. We give you some guidelines.
Accessing this type of trade is very risky. Entrusting your own money to certain software isn’t an easy decision. Therefore, before you decide to become a part of this virtual financial world, allin1bitcoins.com advises you to thoroughly research the most reliable software whose wide range of information allows you to clearly determine that it suits you.
In the meantime, take a look at the most popular analytics tools right now.
Coinmarketcap is currently ranked high and has the greatest popularity among users. This is attributed to the comprehensive and detailed information it provides. Easy access to tabular and graphical data puts it at the very top of this list.
As you watch the value of cryptocurrencies move, it’s important to understand how much money currently exists within a single currency, how it circulates, and be sure to pay attention to capitalization. Large capitalization is usually an indicator of long-term growth, but this can also be data that changes from week to week.
As on ordinary exchange rates, you can see the value of cryptocurrency in USD here. For newer information, refresh the page, but don’t be in a hurry with the decision, since the information on this page can lag a bit.
Cryptowat is another tool that provides many opportunities. The great thing is that it’s free software and is very customizable.
While in free mode, some of the accessible features include filtering the currencies we want the software to display to us. Mostly, these are the best ranked at the moment and are in the sphere of our interest. If you opt for the paid version, a host of additional options will be available to you such as connecting via the API for trading purposes. You can complete your tables yourself with sounds and indicators.
The rapid development of crypto-analytical systems makes this financial trend much more functional. Thanks to the conducted research, it’s much simpler for new users to understand this market and to easily fit in while achieving enviable results.
 Wallets in Upcoming 2024")


