

Technical analysis is an incredibly deep area of financial analysis that is always changing. The constant ebb and flow of markets and the way technology has increased the amount of indicators and oscillators available have made it so professionals can be even more effective, however, this poses a challenge to newcomers who don’t understand the basics and can get overwhelmed by all that is out there.
This isn’t a guide to trading cryptocurrency for beginners but is designed for those who are looking to step up their game with more advanced trading strategies and technical analysis tools. The PDT rule can be tricky to understand and overcome, to learn tricks how to day trade without the PDT click here.
Advanced Charting Types Explained
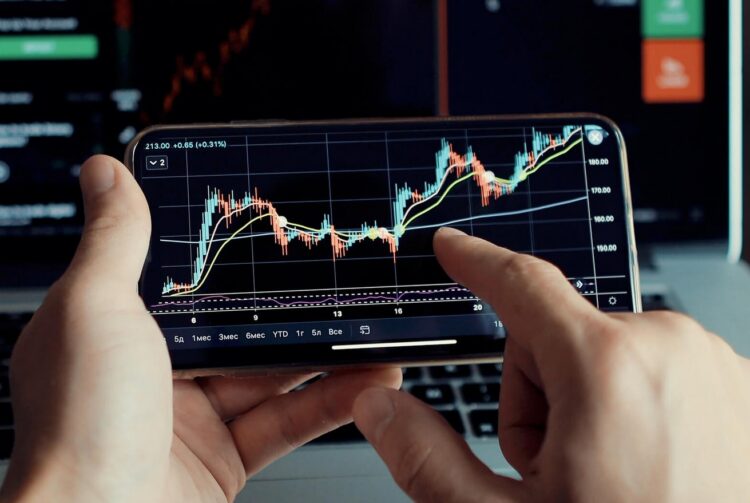
As we’ve explained, this guide is for the more advanced professional, but it is important not to ignore the basics of technical analysis. The basics or building blocks of technical analysis include the understanding of the various types of charts available, most commonly found as line charts or candlestick charts.
Japanese candlesticks, for example, can provide all kinds of information about what to expect from the market. Each candle includes information related to the trading session open, high, low, and close. How these candles form and in what pattern can help to predict the direction of the market.
For example, a doji candle shows indecision in the market, and a struggle for buyers or sellers to move prices very far. Doji tend to form at the top or the bottom of a move, right before a reversal. They also form before a large continuation move and show indecision before that move is made.
Beyond candlesticks and line charts, there are also more advanced charts such as point and figure charts, often done on Microsoft Excel, as well as Heiken Ashi, Renko, and Kagi type charts.
Each chart type can filter out certain types of information and provide unique clues or signals about the market and its potential direction.

Chart Patterns
How these candlesticks and lines form together also can provide bearish or bullish signals and the form of chart patterns. The most common form of chart patterns investors and traders are likely familiar with are triangles.
Triangles
Triangles can lean bullish or bearish, depending on the angle of the trend lines that make up the pattern. Symmetrical triangles can also form, however, more often than not lead to false breakouts and are difficult to trade effectively.
Flags and Pennants
Flags and pennants are a sign of strong move and likely continuation when the flag formation finishes and the pattern resolves. The move tends to be in the original direction and measures the length of the previous flag “pole.”
Wedges
Wedges are triangular like patterns that narrow to an apex and break in the opposite direction as they form.
Top And Bottom Patterns
Head and shoulders, as well as the inverse formation are a common type of bottom or top formation. Adam and Eve double bottoms are another, and there can also be triple bottoms.
Recognizing these patterns and shapes on this website, that may help you with understanding the statistics behind each pattern can help traders choose where to place stop losses, where to take profit, and more.

Technical Analysis Indicators
Chart patterns and candlestick patterns are only one piece of the puzzle to help analysts predict future outcomes in the market. When these patterns aren’t completely clear, or in case a professional trader is seeking more than one signal, there are hundreds of customized technical analysis indicators out there to choose from.
Some of the most popular include:
Relative Strength Index
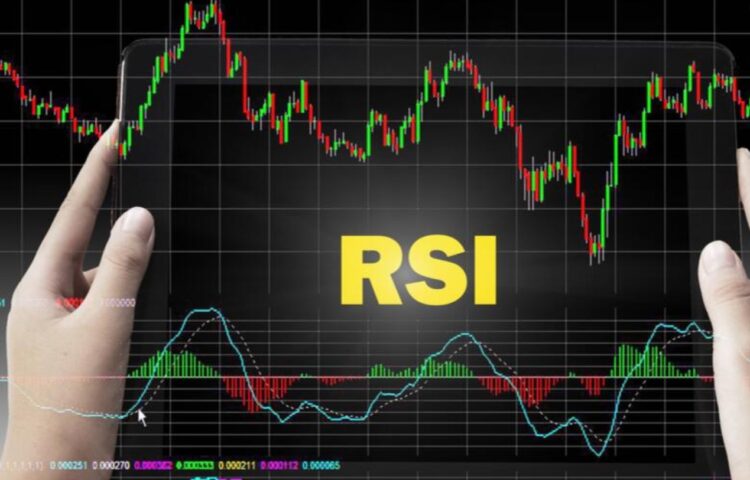
The Relative Strength Index, or RSI for short, is a tool that measures the strength of an underlying asset in relation to price action. It can tell a trader when an asset has reached oversold or overbought levels, which could act as a tipping point for a reversal.
The RSI can be utilized across any timeframe, and like all technical analysis the highest timeframe signals are the most dominant. The RSI can be misleading and can result in divergences between price and the indicator. Smart analysts can use this signal to their advantage, however.
MACD
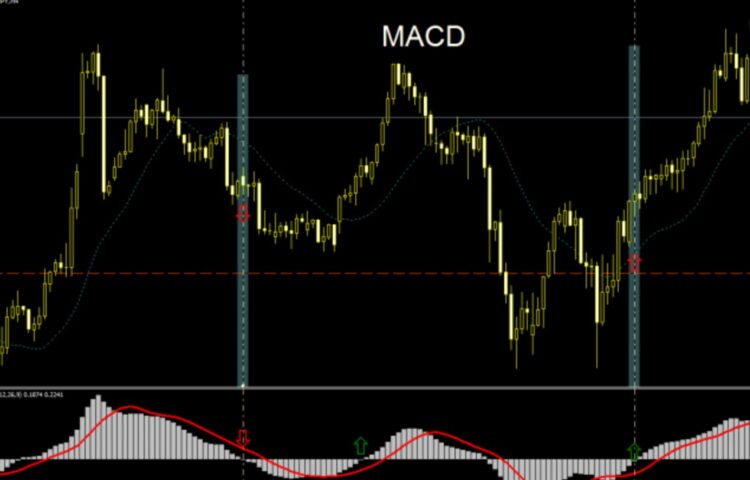
The MACD stands for Moving Average Convergence Divergence and is a momentum measuring indicator. It also works similarly to the RSI in which it can signal when an asset is overbought or oversold.
When the two lines diverge, it is a signal the asset is oversold or overbought. When the lines converge and cross, it can be a signal that the momentum has shifted from bullish to bearish and vice versa.
Ichimoku
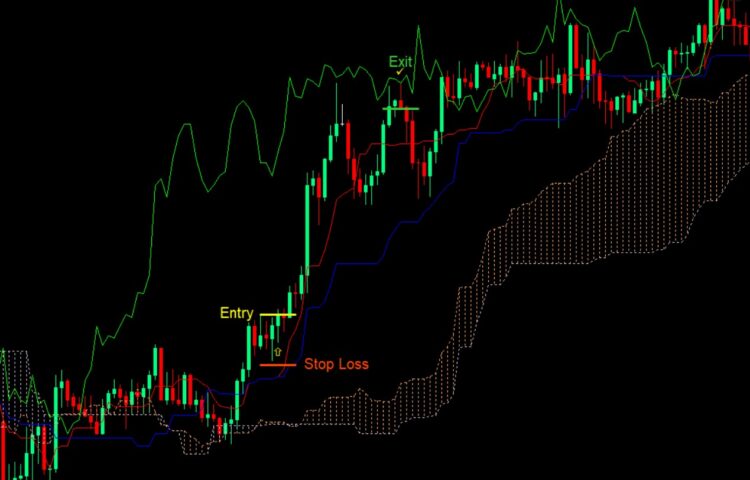
The Ichimoku indicator is an ultra-confusing tool at first glance, which is strange because the tool is designed to provide a full look at the market in just one glance. With understanding of how the tool works and why, it can be one of the most effective indicators available today.
The cloud, or Kumo can act as support or resistance and provide clues about future price action. The Tenken-sen and Kijun-sen are two spans that explain when the market is trending or consolidating, or when the asset is bullish or bearish.
The Chikou span can also help to plot support or resistance and adds to the tool’s overall versatility. It is among the few tools available that looks at the time and not just price.
Bollinger Bands
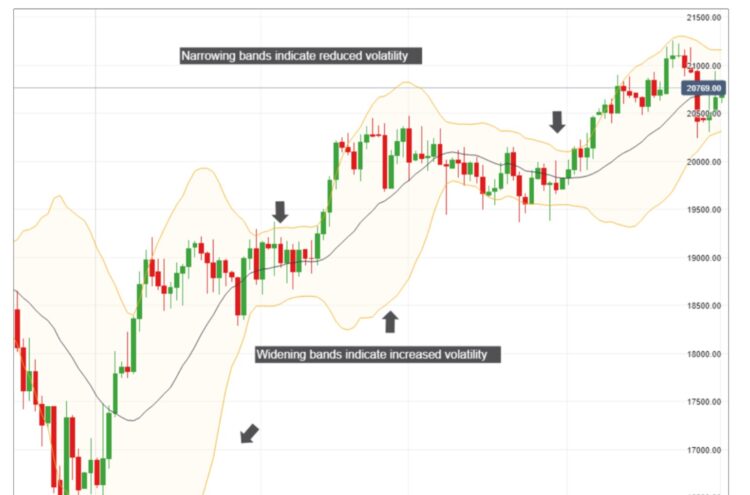
The Bollinger Bands are a volatility measuring tool that has a variety of other uses. It is based on a simple moving average and two standard deviations of the moving average. When the bands narrow and tighten, it says how volatile an asset is. When the bands tighten and “squeeze” it is a sign that an explosive move is coming.
The middle-SMA can also act as a signal to go long or go short if the price of an asset passes through it and closes. The upper and lower bands can also act as support or resistance, as does the middle-BB.
All of these trading tools and many more are available for free as part of the built-in technical analysis suite offered at PrimeXBT, an award-winning margin trading platform.


